This report displays all Candidates with a Direct Placement Start Date within the specified date range..
The following sub-topics are covered. You can scroll down the page to see each sub-topic or click on the link below to be taken directly to that sub-topic:
This report can be executed in the following formats:
HTML
Excel
PDF (Portable Document Format)
RTF (Rich Text Format)
CSV (Comma Separated Values)
To access the Invoice Detail Register - Timecard:
From the main Navigator Bar, select Reporting.
From the drop-down menu, select Reporting & Analytics.
From Reporting & Analytics page, select System Reports in the Folder/Report navigator.
In the System Reports folder, select the Management folder.
In the Management folder, single-click on Direct Placements and click on the Run Selected Report icon to run in HTML format or the Export Report icon to export the report. Alternatively, you can right-click on Direct Placements and select Run Report to run in HTML format or Export As > and then the format.
This report has two filters:
Start Date: Start Date on the Assignment. The "From" date defaults to the first day of the current month. The "To" date defaults to the last day of the current date.
Branch: The Branch associated with the Assignment. This defaults to the Default Branch of the logged-in User.
The following conditions are available:
Equal To (Default for Branch): Data must be equal to the Value. There is only 1 Value option.
Not Equal To: Data must not be equal to the Value. There is only 1 Value option.
Less Than: Data must be before the Value alphabetically. There is only 1 Value option.
Less Than or Equal To: Data must be before or equal to the Value alphabetically. There is only 1 Value option.
Greater Than: Data must be later than the Value alphabetically. There is only 1 Value option.
Greater Than or Equal To: Data must be later or equal to the Value alphabetically. There is only 1 Value option.
Starts With (Not available for Start Date): Data must start with the Value. There is only 1 Value option.
Not Starts With (Not available for Start Date): Data must not start with the Value. There is only 1 Value option.
Ends With (Not available for Start Date): Data must end with the Value. There is only 1 Value option.
Does Not End With (Not available for Start Date): Data must not end with the Value. There is only 1 Value option.
Contains (Not available for Start Date): Data must contain the Value. There is only 1 Value option.
Does not Contain (Not available for Start Date): Data must not contain the Value. There is only 1 Value option.
Is Between (Default for Start Date): Data/Date must be between the two selected Values alphabetically, numerically or date-wise (inclusive). There are two Value options.
Is Not Between: Data/Date must not be between the two selected Values alphabetically, numerically or date-wise (inclusive). There are two Value options.
Is One Of: Data must match one of the selected Values. There are multiple Value options.
Is Not One of: Data must not match any of the selected Values. There are multiple Value options.
You have the following Value options:
IMPORTANT: For performance purposes the following two items should be noted when using the Values droplist. First, in order to enhance performance, once a value is selected, the droplist only displays those items alphabetically/numerically AFTER the selected item. To see all items again, delete the value (select it and press Delete on your keyboard) and then use the droplist. All items will display. Second, in order to enhance performance, the droplist only displays a set number of records. If the list of possible values is longer than the displayed list, select the name at the bottom of the list as the value. When you next click the droplist, the rest of the items display.
Single Value: To select a single value, you can use the drop-list.
Double Values: To select two values, click the drop-list on each value.
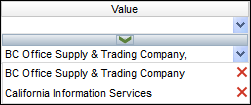
Multiple Values: To select multiple values, click the drop-list on the top field to select a Value to add to the list. To see the items on the list, click the lower drop-list. To remove an item from the list, click the red X to the right of the item.
The first page of the report displays category, sorting and filtering information...as well as the Title of the Report.
The main report displays Grand Totals for Placements and Total Net Amount at the beginning and then data by Branch and Company. Totals are by Company and then Branch. Grand Totals are again shown at the end of the report.
Filter Actions
You can filter the report by Company Name, Branch and Start Date.
If you select more than one filtering criteria, it acts with OR logic within the same category but as AND logic between categories. For example, if you select more than one Company Name, then both companies display on the report (OR logic). However, if you select a Company and a Start Date, then both must be TRUE for data to display on the report (AND logic).
For the Start Date, you can use a handy date range slider. The slider shows beginning and end dates based on the Start Date range you selected on the initial filtering screen. The dates don't exactly match because the slider only displays dates that have placements associated with them. Thus, if you selected a 1/1/2015 start date, but there are no associated placements until 1/20/2015, the slider will show an initial date of 1/20/2015.
By clicking on one of the endpoint balls and moving the mouse left or right...you can adjust the date range. The report will filter by the newly selected date range. NOTE: You may not select a date prior to the original start date or after the original end date.
For the Company Name and Branch, clicking on the box associated with a Value toggles it between checked and unchecked. A checked box means the report is being filtered by the selected value. An unchecked box indicates that no filtering on the selected value is occurring.
For Recruiter, use the droplist to select a Recruiter Name. If you do not want to filter by Recruiter, select the blank option from the drop-list.
Sort Actions
You can sort the report by Branch, Company, Employee Last Name, Employee First Name, Assignment ID, Job Title, Account Manager and Recruiter by clicking on the appropriate icon on the left side of the report.
The first option sorts the selected column in ascending order (A to Z or 0 to 9) and the seconds sorts the selected column in descending order (Z to A or 9 to 0).
Column Actions
You can remove columns from the report in one of two ways.
First, you can uncheck the box beside the column you want to remove on the left side of the report. Second, you can right-click in the column at the top of the report and select Hide Column.
If you want to re-display the column, you can either check the box for the column (on the left side of the report) or right-click in the column to the left or right of the hidden column on top of the report and select Unhide column to Left or Unhide Column to Right (whichever is appropriate).
Report Actions
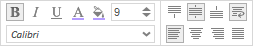
Right-clicking on a column header displays rich-text format controls allowing you to change the font, size, color and style of the selected text. You can also select to wrap text if it goes beyond the width of the cell borders.
Right clicking on a cell in the table selects the data column as a whole. You can use the pop-up controls to change the font, size, color and style of the selected text (including word wrapping). You can also use the top drop-list to select the cells to which you would like to apply the new format. For example, you might want to highlight values above 50. In this case, right-click on a cell that displays "50", select how you want to present numbers in the list that are greater than 50 (e.g., bold, larger font, green color) and select "Apply to greater values" from the droplist. This causes all numbers in the column that are greater than 50 to use the new format (e.g., bold, larger font, green color).
The following options are available from the top droplist:
Apply to all: This applies any formatting changes to all rows in the selected table column.
Apply to equal values: This applies any formatting changes to only those rows in the selected table column that match the data in the selected cell.
Apply to unequal values: This applies any formatting changes to only those rows in the selected table column that do not match the data in the selected cell.
Apply to greater values: This applies any formatting changes to only those rows in the selected table column that are greater than the amount in the selected cell.
Apply to greater than or equal values: This applies any formatting changes to only those rows in the selected table column that are greater than or equal to the amount in the select cell.
Apply to lesser values: This applies any formatting changes to only those rows in the selected table column that are less than the amount in the selected cell.
Apply to less than or equal values: This applies any formatting changes to only those rows in the selected table column that are less than or equal to the amount in the select cell.
Toolbar Actions
The toolbar allows you to perform the following actions:
 Clear Options: Clicking this icon allows you to undo changes you have made to the report. Once you click the icon, the following options display:
Clear All: This clears all changes you made to the report including sorting changes, column changes and styling changes. It basically reverts the report back to way it was originally presented.
Clear Styling Changes: This clears only styling changes. Styling changes include changes made to the report itself (e.g. changing the font, bolding or italicizing a cell, etc.). It does not impact sorting or column changes.
Clear Column Changes: This clears only column changes. Column changes include hiding columns. It does not impact sorting or styling changes.
 Save Changes: This option saves the changes you made to the report. Since this report is a system-delivered report, you may not save changes to the report itself. However, you can save your changes as a user report. When saved as a User Report, the changes you made (hiding columns, changing sort order, changing styling) will only be seen when your user executes the report. Everyone else will see the report as it was originally designed. When you click on the icon, the following options display:
Save Changes as User Report: This saves your changes as a user report.
Delete User Report: This is only active if you have a User Report associated with the displayed report. If so, this option allows you to remove your User Report. This will cause you to lose all changes you have made and the next time you run the report, it will display as it was originally designed.
 Execute Selected Report: This executes the report, with all changes included, in the format displayed. For example, if you click the Excel icon, the report will execute in Excel format. If you want to select a different format, use the droplist to select from:
 : Excel
 : PDF (Portable Document Format)
 : RTF (Rich Text Format)
 : CSV (Comma Separated Values)
NOTE: Once you select one of the above options, you will have the option to open or save the newly formatted table. Make your selection and click OK.

The page locator allows you to quickly move through the pages of the report. The first icon moves to the first page of the report. The second icon moves to the previous page of the report. The third icon moves to the next page of the report and the last icon moves to the final page of the report. The field displays the page number you are on and the second number (after the slash) shows the total number of pages in the report. You can type a page number in the field to move directly to that page.
The find field allows you to quickly find information in the table. Simply type in all or a portion of a word or number in either the Column headers or the rows and all instances of it are highlighted in the table with the first instance selected. The up and down arrows allow you to move to the previous (up arrow) or next (down arrow) instance of the data you are trying to Find. This is helpful if the table contains a lot of data and you want to quickly move to a specific name or number in the table.