Payroll Deductions
This is a sub-report used by the 01 Payroll Summary Dashboard by Check Date dashboard. This table displays deductions for the selected Corporation and Check Date range. Rows display the deduction category (e.g. 125 Cash, 401K, etc.) and Code (Child Support $, Employer Deduction $, etc.). The Column displays the Employee Deduction Amount and Employer Contribution for each deduction category. Total Deductions (both Employee Deduction and Employer Contribution) for all categories is also shown.
Executable Formats
This report can be executed in the following formats:
- HTML
- Excel
- PDF (Portable Document Format)
- RTF (Rich Text Format)
- CSV (Comma Separated Values)
Accessing the Report
To access this report:
- From the Navigator, select Reporting.
- From the fly-out menu, select Reporting & Analytics.
- From Reporting & Analytics page, select System Reports in the Folder/Report navigator.
- In the System Reports folder, select the Payroll folder.
- In the Payroll folder, select the Dashboard - Payroll Summary by Check Date folder.
- In the Dashboard - Payroll Summary by Check date folder, single-click on Payroll Deductions and click on the Run Selected Report icon to run in HTML format or the Export Report icon to export the report. Alternatively, you can right-click on Payroll Deductions and select Run Report to run in HTML format or Export As > and then the format. You can also double-click on the report name to run it in HTML format.
Filters
This report uses the Advanced Report Filters control. This control allows you to add filters, change filter logic, etc.
The Advanced Report Filters Control
The Advanced Report Filters Control is made up of 3 areas:

- Area 1: The first area lists all fields that can be selected as a filter. The droplist at the top allows you to select the Category. Once you select a Category, the area below it displays the fields associated with that Category. To add a field as a filter, select the field from the list and then click Add. The field is added to the filter list in Area 2.
-
Area 2: The second area lists all current filters. You can rearrange the order of the filters by using the up and down arrow icons to the right of the filter field. You can remove a filter by clicking the red "x".
- Below the filters (where it reads "Equal To" in the screen shot), you can select the filter Condition (see below a list of conditions applicable to each defaulted filter). Next to it, you can select the value to which the Condition applies. For example, if your filter is Company Name and the Condition is "Equal To" then the selection you make in the value drop list (which will be a list of Company Names) determines the Company Name selected for the reprint.
- Below the Condition and Values fields is the Logic selection. This determines whether the current filter will interact with the filter under it in the filter list using AND or OR logic. AND logic makes sure that both filter's Conditions and Values are met in order to include it on the report. OR logic includes data that matches EITHER the current filter's Conditions and Values OR the next filter's Conditions and Values.
- Below the Logic selector is a checkbox that allows you to group filter items. Essentially, in terms of a logical statement, this puts a parenthesis around multiple filters. For example, the logical sentence "A and (B or C)" indicates that data will be selected if it is associated A and EITHER B or C.
- Area 3:The final area displays the logical sentence you are creating based on your selections in Area 1 and Area 2.
Defaulted Filters
-
Corporation: The Corporation associated with the payroll process.
The following conditions are available:
- Equal To: Data must be equal to the Value. There is only 1 Value option.
- Not Equal To: Data must not be equal to the Value. There is only 1 Value option.
- Less Than: Data must be before the Value alphabetically. There is only 1 Value option.
- Less Than or Equal To: Data must be before or equal to the Value alphabetically. There is only 1 Value option.
- Greater Than: Data must be later than the Value alphabetically. There is only 1 Value option.
- Greater Than or Equal To: Data must be later or equal to the Value alphabetically. There is only 1 Value option.
- Starts With: Data must start with the Value. There is only 1 Value option.
- Not Starts With: Data must not start with the Value. There is only 1 Value option.
- Ends With: Data must end with the Value. There is only 1 Value option.
- Does Not End With: Data must not end with the Value. There is only 1 Value option.
- Contains: Data must contain the Value. There is only 1 Value option.
- Does not Contain: Data must not contain the Value. There is only 1 Value option.
- Is Between: Data must be between the two selected Values alphabetically (inclusive). There are two Value options.
- Is Not Between: Data must not be between the two selected Values alphabetically (inclusive). There are two Value options.
- Is One Of: Data must match one of the selected Values. There are multiple Value options.
- Is Not One of: Data must not match any of the selected Values. There are multiple Value options.
-
Check Date: The Date associated with the check. You may change both the Condition and the Value. The Value depends on the Condition selected.
The following conditions are available:
- Equal To: Date must be equal to the Value. There is only 1 Value option.
- Not Equal To: Date must not be equal to the Value. There is only 1 Value option.
- Less Than: Date must be earlier than the Value. There is only 1 Value option.
- Less Than or Equal To: Date must be earlier than or equal to the Value. There is only 1 Value option.
- Greater Than: Date must be later than the Value. There is only 1 Value option.
- Greater Than or Equal To: Date must be later than or equal to the Value. There is only 1 Value option.
- Is Between: Date must be between the two selected dates (inclusive). There are two Value options.
- Is Not Between: Date must not be between the two selected dates (inclusive). There are two Value options.
- Is One Of: Date must match one of the selected dates. There are multiple Value options.
- Is Not One of: Date must not match any of the selected dates. There are multiple Value options.
You have the following Value options:
IMPORTANT! For performance purposes the following two items should be noted when using the Values droplist. First, in order to enhance performance, once a value is selected, the droplist only displays those items alphabetically/numerically AFTER the selected item. To see all items again, delete the value (select it and press Delete on your keyboard) and then use the droplist. All items will display. Second, in order to enhance performance, the droplist only displays a set number of records. If the list of possible values is longer than the displayed list, select the name at the bottom of the list as the value. When you next click the droplist, the rest of the items display.
-
<Blank>: By selecting the date in the Value column and deleting it, the Dashboard returns all possible Values. For example, if you leave the Date value blank when the Condition is Equal To, all Candidate Adds (for the specified branch) display in the table.
-
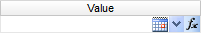
Single Value: To select a single value, you can click the Calendar icon to display a Calendar control allowing you to select a date. click the droplist and select the item from the list. You can click the down-arrow to select from a list of dates. You can also click the function icon (fx) to select from a list of relative dates (see below).

-
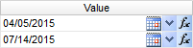
Double Values: To select two values, click the desired icon (see above) on each value and select the date.
-
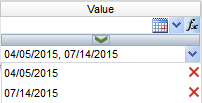
Multiple Values: To select multiple values, click the desired icon on the top field to select a date to add to the list. You can also type the date and click the middle arrow to add it to the list. To see the items on the list, click the lower droplist. To remove an item from the list, click the red X to the right of the item.

You can enter a date one of 4 ways:
- Type in the date (e.g. 02/14/2015).
- Use the calendar control (
 ) to select a date.
 - Use the drop-list (
 ) to choose from a list of invoice dates (based on the other filtering criteria you've selected).
 -
Use the function icon (
 ) to select from the following (all examples are based on Tuesday, July 14th, 2015 date):
- Today: Inserts today's date (July 14, 2015).
- Tomorrow: Inserts tomorrow's date (July 15, 2015).
- Yesterday: Inserts yesterday's date (July 13, 2015).
- Today Plus 7/30/60/90 Days: Inserts the day 7, 30, 60 or 90 days in the future (60 days = September 12, 2105).
- Today Minus 7/30/60/90 Days: Inserts the day 7, 30, 60 or 90 days in the past (60 days = May 15, 2015).
- First Day of Current/Last/Next Month: Inserts first day of selected month (Current = July 1, 2015).
- Last Day of Current/Last/Next Month: Inserts last day of selected month (Current = July 31, 2015).
- First Day of Current/Last/Next Year: Inserts first day of selected year (Current = January 1, 2015).
- Last Day of Current/Last/Next Year: Inserts last day of selected year (Current = December 31, 2015).
- First Day of Current/Last/Next Quarter: Inserts first day of selected quarter (Current = July 1,2015).
- Last Day of Current/Last/Next Quarter: Inserts last day of selected quarter (Current = September 30, 2015).
- Monday of Current/Last/Next Week: Inserts Monday of selected week (Current = July 13, 2015).
- Friday of Current/Last/Next Week: Inserts Friday of selected week (Current = July 17, 2015).


Report Actions
The report displays the Deduction Category in the left-most column, the Deduction Code in the center column and the Deduction Amount in the right-most column. Total Deductions is listed at the bottom of the table.
Sort Actions
You can sort the report by Corporation, Deduction Category and/or Deduction Code by clicking on the appropriate icon on the left side of the report.
The first option sorts the selected column in ascending order (A to Z or 0 to 9) and the seconds sorts the selected column in descending order (Z to A or 9 to 0).
Column Actions
You can remove columns from the report in one of two ways.
First, you can uncheck the box beside the column you want to remove on the left side of the report. Second, you can right-click in the column at the top of the report and select Hide Column.
If you want to re-display the column, you can either check the box for the column (on the left side of the report) or right-click in the column to the left or right of the hidden column on top of the report and selectUnhide column to LeftorUnhide Column to Right(whichever is appropriate).
Report Actions

Right-clicking on a column header displays rich-text format controls allowing you to change the font, size, color and style of the selected text. You can also select to wrap text if it goes beyond the width of the cell borders.
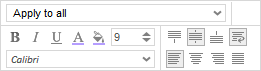
Right-clicking on a cell in the table selects the data column as a whole. You can use the pop-up controls to change the font, size, color and style of the selected text (including word wrapping). You can also use the top drop-list to select the cells to which you would like to apply the new format. For example, you might want to highlight Order totals above 50. In this case, right-click on a cell that displays "50" in the Orders column, select how you want to present numbers in the list that are greater than 50 (e.g., bold, larger font, green color) and select "Apply to greater values" from the droplist. This causes all numbers in the column that are greater than 50 to use the new format (e.g., bold, larger font, green color).
The following options are available from the top droplist:
- Apply to all: This applies any formatting changes to all rows in the selected table column.
- Apply to equal values: This applies any formatting changes to only those rows in the selected table column that match the data in the selected cell.
- Apply to unequal values: This applies any formatting changes to only those rows in the selected table column that do not match the data in the selected cell.
- Apply to greater values: This applies any formatting changes to only those rows in the selected table column that are greater than the amount in the selected cell.
- Apply to greater than or equal values: This applies any formatting changes to only those rows in the selected table column that are greater than or equal to the amount in the select cell.
- Apply to lesser values: This applies any formatting changes to only those rows in the selected table column that are less than the amount in the selected cell.
- Apply to less than or equal values: This applies any formatting changes to only those rows in the selected table column that are less than or equal to the amount in the select cell.
Toolbar Actions
The toolbar allows you to perform the following actions:
-
 Clear Options: Clicking this icon allows you to undo changes you have made to the report. Once you click the icon, the following options display:
 -
Clear All: This clears all changes you made to the report including sorting changes, column changes and styling changes. It basically reverts the report back to way it was originally presented.
-
Clear Styling Changes: This clears only styling changes. Styling changes include changes made to the report itself (e.g. changing the font, bolding or italicizing a cell, etc.). It does not impact sorting or column changes.
-
Clear Column Changes: This clears only column changes. Column changes include hiding columns. It does not affect sorting or styling changes.
-
 Save Changes: This option saves the changes you made to the report. Since this report is a system-delivered report, you may not save changes to the report itself. However, you can save your changes as a user report. When saved as a User Report, the changes you made (hiding columns, changing sort order, changing styling) will only be seen when your user executes the report. Everyone else will see the report as it was originally designed. When you click on the icon, the following options display:
 -
Save Changes as User Report: This saves your changes as a user report.
-
Delete User Report: This is only active if you have a User Report associated with the displayed report. If so, this option allows you to remove your User Report. This will cause you to lose all changes you have made and the next time you run the report, it will display as it was originally designed.
-
 Execute Selected Report: This executes the report, with all changes included, in the format displayed. For example, if you click the Excel icon, the report will execute in Excel format. If you want to select a different format, use the droplist to select from:
-
 : Excel
 -
 : PDF (Portable Document Format)
 -
 : RTF (Rich Text Format)
 -
 : CSV (Comma Separated Values)
Note: Once you select one of the above options, you will have the option to open or save the newly formatted table. Make your selection and click OK.
-
-
Page locator and Find field

The page locator allows you to quickly move through the pages of the report. The first icon moves to the first page of the report. The second icon moves to the previous page of the report. The third icon moves to the next page of the report and the last icon moves to the final page of the report. The field displays the page number you are on and the second number (after the slash) shows the total number of pages in the report. You can type a page number in the field to move directly to that page.
The Find field allows you to quickly find information in the table. Type in all or a portion of a word or number in either the Column headers or the rows and all instances of it are highlighted in the table with the first instance selected. The up and down arrows allow you to move to the previous (up arrow) or next (down arrow) instance of the data you are trying to Find. This is helpful if the table contains a lot of data and you want to quickly move to a specific name or number in the table.


