Monthly Trend Sales Analysis by Order Branch and Company
This report displays Bill and Net Amount by month for the current and previous year.
Executable Formats
This report can be executed in the following formats:
- HTML
- Excel
- PDF (Portable Document Format)
- RTF (Rich Text Format)
- CSV (Comma Separated Values)
Accessing the Report
To access the Invoice Detail Register - Timecard:
- From the Navigator, select Reporting.
- From the fly-out menu, select Reporting & Analytics.
- From Reporting & Analytics page, select System Reports in the Folder/Report navigator.
- In the System Reports folder, select the Management Financials folder.
- In the Management Financials folder, single-click on Monthly Trend Sales Analysis by Order Branch and Company and click on the Run Selected Report icon to run in HTML format or the Export Report icon to export the report. Alternatively, you can right-click on Monthly Trend Sales Analysis by Order Branch and Company and select Run Report to run in HTML format or Export As > and then the format. You can also double-click on the report name to run it in HTML format.
Filters
This report has two filters:
- Corporation: Corporation associated with the sale. This defaults to the Default Corporation of the logged-in User's Default Branch. While the filtering screen allows you to change the Condition, the report only accepts one corporation at a time.
- Order Branch: Branch associated with the Job Order.
The following conditions are available:
- Equal To (default for Corporation): Data must be equal to the Value. There is only 1 Value option.
- Not Equal To: Data must not be equal to the Value. There is only 1 Value option.
- Less Than: Data must be before the Value alphabetically. There is only 1 Value option.
- Less Than or Equal To: Data must be before or equal to the Value alphabetically. There is only 1 Value option.
- Greater Than: Data must be later than the Value alphabetically. There is only 1 Value option.
- Greater Than or Equal To: Data must be later or equal to the Value alphabetically. There is only 1 Value option.
- Starts With: Data must start with the Value. There is only 1 Value option.
- Not Starts With: Data must not start with the Value. There is only 1 Value option.
- Ends With: Data must end with the Value. There is only 1 Value option.
- Does Not End With: Data must not end with the Value. There is only 1 Value option.
- Contains: Data must contain the Value. There is only 1 Value option.
- Does not Contain: Data must not contain the Value. There is only 1 Value option.
- Is Between: Data/Date must be between the two selected Values alphabetically, numerically or date-wise (inclusive). There are two Value options.
- Is Not Between: Data/Date must not be between the two selected Values alphabetically, numerically or date-wise (inclusive). There are two Value options.
- Is One Of (Default for Order Branch): Data must match one of the selected Values. There are multiple Value options.
- Is Not One of: Data must not match any of the selected Values. There are multiple Value options.
You have the following Value options:
IMPORTANT! For performance purposes the following two items should be noted when using the Values droplist. First, in order to enhance performance, once a value is selected, the droplist only displays those items alphabetically/numerically AFTER the selected item. To see all items again, delete the value (select it and press Delete on your keyboard) and then use the droplist. All items will display. Second, in order to enhance performance, the droplist only displays a set number of records. If the list of possible values is longer than the displayed list, select the name at the bottom of the list as the value. When you next click the droplist, the rest of the items display.
-
Single Value: To select a single value, you can use the drop-list.
-
Double Values: To select two values, click the drop-list on each value.
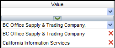
-
Multiple Values: To select multiple values, click the drop-list on the top field to select a Value to add to the list. To see the items on the list, click the lower drop-list. To remove an item from the list, click the red X to the right of the item.


Report Actions
This report is a cross-tab report that displays the Order Branch and then Companies within that Order Branch. For each company, the Sales per Month for the previous and current year are displayed as well as the combined sales for both years for the month. Company totals are displayed for each year and for the combined years. Finally, totals for all companies are displayed by month as well as a grand total for all months for both the previous and current years.
Filter Actions
You can filter the report by Order Branch.
If you select more than one filtering criteria, it acts with OR logic. For example, if you select more than one Order Branch, then all display on the report (OR logic).
Clicking on the box associated with a Value toggles it between checked and unchecked. A checked box means the report is being filtered by the selected value. An unchecked box indicates that no filtering on the selected value is occurring.
Report Actions
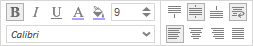
Right-clicking on a column header displays rich-text format controls allowing you to change the font, size, color and style of the selected text. You can also select to wrap text if it goes beyond the width of the cell borders.
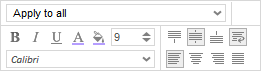
Right-clicking on a cell in the table selects the data column as a whole. You can use the pop-up controls to change the font, size, color and style of the selected text (including word wrapping). You can also use the top drop-list to select the cells to which you would like to apply the new format. For example, you might want to highlight values above 50. In this case, right-click on a cell that displays "50", select how you want to present numbers in the list that are greater than 50 (e.g., bold, larger font, green color) and select "Apply to greater values" from the droplist. This causes all numbers in the column that are greater than 50 to use the new format (e.g., bold, larger font, green color).
The following options are available from the top droplist:
- Apply to all: This applies any formatting changes to all rows in the selected table column.
- Apply to equal values: This applies any formatting changes to only those rows in the selected table column that match the data in the selected cell.
- Apply to unequal values: This applies any formatting changes to only those rows in the selected table column that do not match the data in the selected cell.
- Apply to greater values: This applies any formatting changes to only those rows in the selected table column that are greater than the amount in the selected cell.
- Apply to greater than or equal values: This applies any formatting changes to only those rows in the selected table column that are greater than or equal to the amount in the select cell.
- Apply to lesser values: This applies any formatting changes to only those rows in the selected table column that are less than the amount in the selected cell.
- Apply to less than or equal values: This applies any formatting changes to only those rows in the selected table column that are less than or equal to the amount in the select cell.